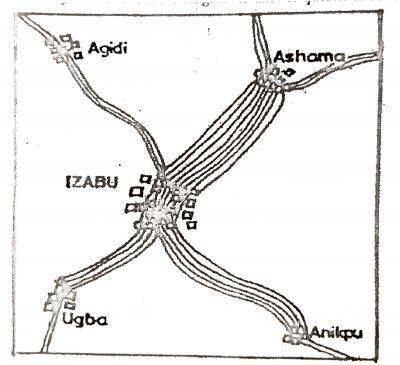
Concept:A flow chart is a statistical map that uses lines or bands to show the direction and volume of movement between places.
Explanation:Lines connect IZABU town to its surrounding towns.
Each line gives the direction of passenger traffic.
The number of lines shows the volume of movement.
Using the scale,
1 line
=1,500 persons.
More lines mean a greater number of passengers.
Thus, the method represented uses arrows or lines to display flow.
This is not a dot map, isohaline map, or bar chart.
Answer:C. Flow chart