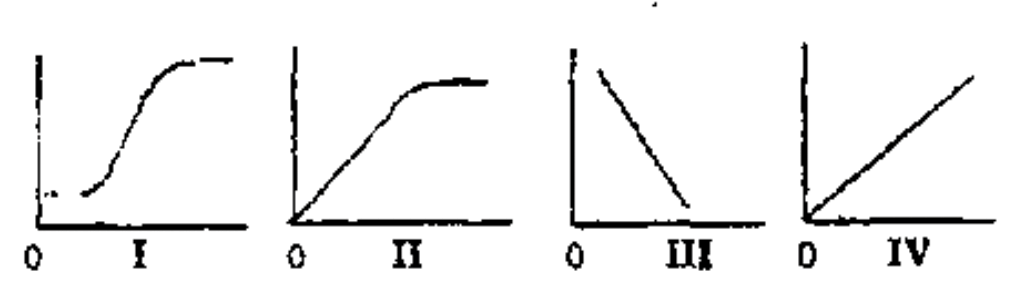
Concept:The titration curve for a strong acid with a strong base is S-shaped, starting at low
pH and ending at high
pH.
Explanation:Initially, the strong acid solution has a low
pH due to a high concentration of
H+ ions.
As the strong base is added gradually, the
pH increases slowly.
Near the equivalence point, a very small volume of base causes a sharp rise in
pH.
For a strong acid–strong base titration, this steep rise is centred around
pH≈7.
After excess base is added, the
pH becomes high and remains nearly constant.
Hence, the correct graph is the one that shows a low starting
pH, a steep vertical rise around
pH 7, and a high final
pH.
Answer:Graph II (Option B)