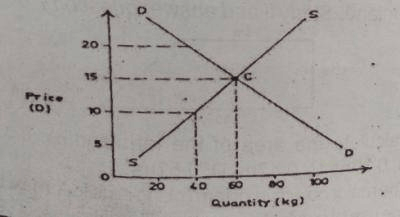
Concept:The intersection of the demand and supply curves in a market graph is called the equilibrium point.Explanation:In the graph, part C is placed where the demand curve and supply curve cross each other.At that point, the quantity demanded equals the quantity supplied.Thus, label C does not represent a price or quantity alone; it represents the equilibrium point.Answer:D. equilibrium point