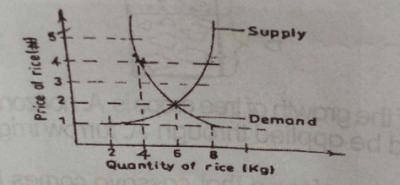
Concept:The graph shows the market equilibrium point for rice.Explanation:The demand curve and the supply curve intersect at one point.At this intersection, the quantity demanded equals the quantity supplied.This point gives the equilibrium price for rice.The graph does not mainly show a shift in demand or supply curves.It also does not illustrate excess demand at equilibrium.Answer:C. describes the equilibrium price for rice