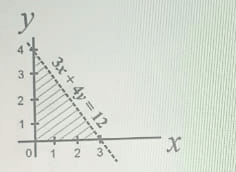
Concept:The graph shows the region of points that satisfy a set of linear inequalities in the first quadrant.Explanation:The boundary line passes through (4,0) and (0,3), so its equation is 3x+4y=12.The shaded region lies below this boundary line, meaning the value of the expression is less than 12.Thus the inequality is 3x+4y<12.The graph is restricted to the positive side of both axes, so x≥0 and y≥0.Therefore, the inequalities represented are 3x+4y<12, x≥0, y≥0.Answer:D. 3x+4y<12, x≥0, y≥0