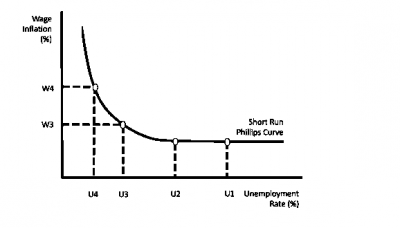
Concept:The diagram illustrates the Phillips curve trade-off between wage rate and unemployment.Explanation:The Phillips curve shows an inverse relationship between wage rate and unemployment. In the short run, lower unemployment creates competition for workers, so wage rates tend to rise faster. Higher unemployment means more available workers, so wage pressure is weaker. When reading the diagram, the vertical axis represents the wage rate and the horizontal axis represents unemployment. The downward-sloping curve shows that an increase in unemployment is associated with a decrease in the wage rate. Therefore, the diagram does not show a minimum wage floor or a comparison between two wage levels. It specifically shows the Phillips curve relationship between wages and unemployment in an economy.Answer:D. Wage rate and unemployment.