Concept:An abnormal demand curve shows a direct relationship between price and quantity demanded, which is the opposite of the law of demand.
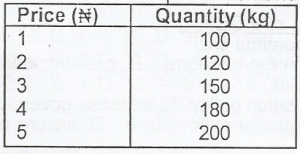
Explanation:From the schedule, when the price is low at
₦1, the quantity demanded is
100 units.
When the price rises to
₦5, the quantity demanded also rises to
200 units.
This shows that quantity demanded increases as price increases.
Therefore, the curve slopes upward from left to right.
This is contrary to a normal demand curve, where quantity demanded falls as price rises.
Hence, the graph represents an abnormal demand curve.
Answer:C. an abnormal demand curve.