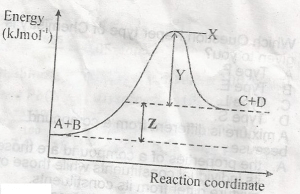
Concept:An energy profile diagram shows the energy changes during a reaction as a vertical gap between energy levels.Explanation:In the diagram, Z is the vertical distance between the energy level of the reactants and the energy level of the products.This energy difference is the heat of reaction, also known as the enthalpy change, ΔH.Answer:A. heat of reaction